2.1.2 Designing, creating and refining algorithms
Identify the inputs, processes, and outputs for a problem
In computer science, it is important to identify the inputs, processes, and outputs of a problem in order to design an effective solution. This process involves understanding the requirements of the problem, breaking it down into smaller parts, and identifying the key data and operations needed to solve it. This study guide will provide a clear and easy to understand explanation of this process, its significance, and examples to help students understand how to identify inputs, processes, and outputs for a problem in computer science.
Section 1: Inputs The inputs of a problem in computer science refer to the data that is required to solve the problem. This could be information entered by a user, data retrieved from a database, or sensor readings from a device. It is important to clearly identify the inputs of a problem to ensure that the solution is tailored to meet the specific requirements of the problem. For example, if the problem is to calculate the total cost of a shopping cart, the inputs would be the prices and quantities of the items in the cart.
Section 2: Processes The processes of a problem in computer science refer to the operations that are performed on the inputs to produce the desired outputs. These processes can range from simple arithmetic operations to complex algorithms. It is important to identify the processes involved in a problem to ensure that the solution is efficient, accurate, and meets the requirements of the problem. For example, if the problem is to convert a temperature from Celsius to Fahrenheit, the process would be to multiply the Celsius temperature by 1.8 and then add 32.
Section 3: Outputs The outputs of a problem in computer science refer to the results that are produced by applying the processes to the inputs. These outputs could be displayed on a screen, printed on paper, or stored in a database. It is important to clearly identify the outputs of a problem to ensure that the solution meets the requirements of the problem. For example, if the problem is to calculate the area of a rectangle, the output would be the area value.
Practice Questions:
- What are the inputs, processes, and outputs for a problem that involves calculating the average of a set of numbers?
- Identify the inputs, processes, and outputs for a problem that involves finding the shortest route between two locations on a map.
- What are the inputs, processes, and outputs for a problem that involves sorting a list of names in alphabetical order?
- Identify the inputs, processes, and outputs for a problem that involves converting a binary number to a decimal number.
Answers:
-
Inputs: Set of numbers Processes: Add all numbers and divide by the count of numbers Outputs: Average value
-
Inputs: Starting location, destination location, map data Processes: Analyze the map data to find the shortest route Outputs: Shortest route
-
Inputs: List of names Processes: Sort the names alphabetically Outputs: Sorted list of names
-
Inputs: Binary number Processes: Convert the binary number to decimal using the appropriate formula Outputs: Decimal number
Structure Diagrams
In computer science, structure diagrams are commonly used to help decompose a problem and understand how it can be broken down into smaller elements. One type of structure diagram used is the top-down diagram, which is a type of tree diagram.
The process involves starting with the whole problem in a box at the top and then creating boxes beneath it to describe how the problem can be broken down into smaller elements. Each sub-problem can then be further broken down into smaller sub-elements if necessary.
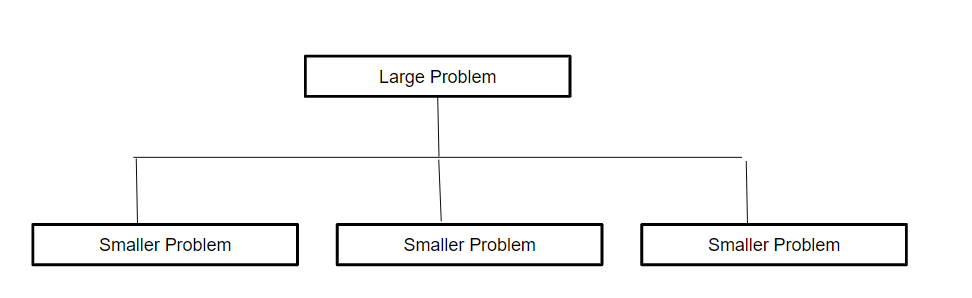
The goal is to break down the problem into enough detail that an easy solution can be found. This approach to problem-solving is known as top-down design and is an effective way to tackle complex problems in computer science.
Question: What is a top-down diagram and how is it used in problem-solving?
Answer: A top-down diagram is a type of tree diagram that is used in problem-solving to decompose a problem into smaller, more manageable elements. The diagram starts with a box at the top that contains the whole problem, and then boxes beneath it are added to describe how that problem can be broken down into smaller sub-problems. Each sub-problem can then be further decomposed into smaller sub-elements if needed, until the diagram is complete and all the problems are broken down into enough detail to find a solution. The top-down diagram is a popular way to visualize the structure of a problem and can make it easier to understand how it can be decomposed and solved.
Create, interpret, correct, complete, and refine algorithms
Algorithms are a critical component of computer science. They are a set of instructions that a computer can follow to solve a problem. In this study guide, we will cover the different ways to create, interpret, correct, complete, and refine algorithms using pseudocode, flowcharts, and high-level programming languages.
Pseudocode:
Pseudocode is a way of writing out an algorithm using a mix of English and programming language. It helps programmers to create a plan for how their program will work before they start coding. Pseudocode uses a logical structure that makes it easier to read and understand.
To create pseudocode, start with the problem statement and then break it down into smaller steps. Write out each step using a combination of English and programming language, making sure to use proper syntax and indentation.
Example: Problem statement: Write a program that finds the largest number in a list of integers.
Pseudocode:
- Create a list of integers
- Set the variable largest to the first integer in the list
- For each integer in the list
- If the integer is greater than the value of largest, set largest to that integer
- Output the value of largest
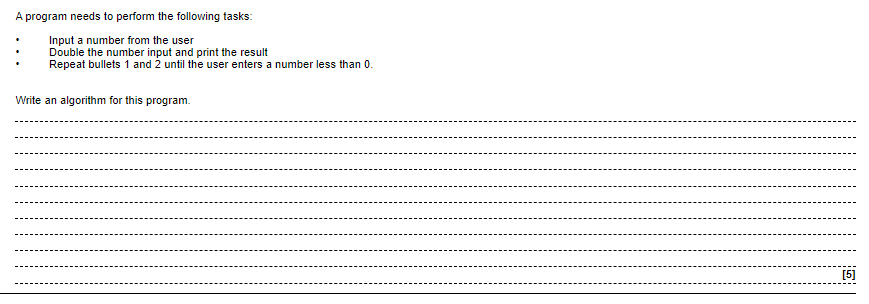
Practice question: Write pseudocode for a program that calculates the area of a rectangle.
- Flowcharts: Flowcharts are another way of representing algorithms using graphical symbols and arrows to represent the flow of instructions. They are useful for understanding how a program works and identifying potential errors. Flowcharts can also be used to communicate the algorithm to other programmers or stakeholders.

To create a flowchart, start with the problem statement and then create symbols for each step in the process. Connect the symbols with arrows to show the flow of instructions.
Example: Problem statement: Write a program that inputs a number and outputs if it is a positive or negative and adds 1 untill it is positive.
Flowchart: 
Practice question: Create a flowchart for a program that calculates the perimeter of a square.
- High-level programming languages: High-level programming languages are a way to write algorithms using human-readable code. They are designed to be easy to learn and use, with syntax and structure that are similar to natural language. High-level programming languages are translated into machine code by a compiler or interpreter, making them accessible to computers.
To write an algorithm in a high-level programming language, start by selecting the appropriate language for the task. Then, write the code using the syntax and structure of the language. Test and debug the code to ensure that it works as expected.
Example: Problem statement: Write a program that finds the largest number in a list of integers.
Python code: numbers = [3, 7, 2, 9, 5] largest = numbers[0] for number in numbers: if number > largest: largest = number print(largest)
Practice question: Write a program in Python that calculates the average of five numbers.
Conclusion: In this study guide, we covered three different ways to create, interpret, correct, complete, and refine algorithms using pseudocode, flowcharts, and high-level programming languages. By understanding these methods, you can develop effective algorithms that solve complex problems. Remember to practice and test your algorithms to ensure they work as expected.
Identifying errors
Identifying common errors in programming
Programming can be a challenging task, even for experienced developers. Identifying common errors is an essential part of debugging and can help you save time and avoid frustration. Here are some common errors you may encounter in programming:
-
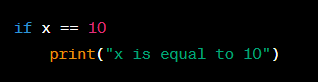
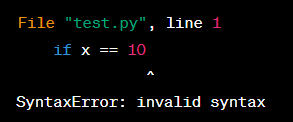
Syntax Errors: These occur when the code violates the rules of the programming language. It usually results in the code not being able to run at all. Syntax errors are identified by the interpreter, and the line number where the error occurs is usually displayed. For example, in Python, forgetting to put a colon at the end of an if statement will result in a syntax error:
Output:
Logical Errors: These errors occur when the code runs, but it doesn't produce the expected output. Logical errors can be tricky to identify, but they are usually caused by mistakes in the program's logic. For example, the program
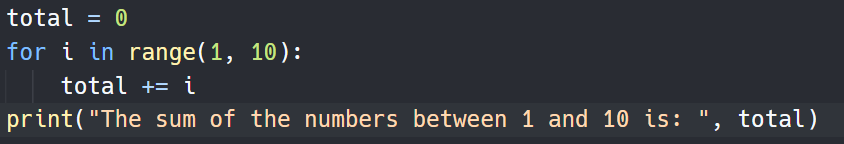
Output:
![]()
The answer should have been 55, can you tell why?
Runtime Errors:
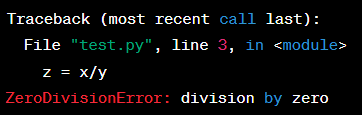
These errors occur when the code is running and something goes wrong. They can be caused by a variety of issues such as invalid user input, insufficient memory, or network problems. In Python, a common runtime error is a "ZeroDivisionError." For example:
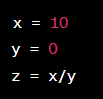
Output:
Introduction: Trace tables are used to help understand how an algorithm works by recording the values of variables as the program runs. By following the flow of the algorithm and recording the values of the variables, it is possible to check the accuracy of the algorithm and find any mistakes.
Creating a Trace Table:
- Identify the variables: To create a trace table, you need to identify all the variables used in the algorithm.
- Add columns for each variable: Create a column for each variable and add a row for each step in the algorithm.
- Fill in the initial values: At the start of the algorithm, fill in the initial values for each variable.
- Follow the algorithm: Step through the algorithm and update the values of each variable at each step.
- Check for accuracy: Check the final values in the trace table to ensure that the algorithm is working correctly.
Using a Trace Table:
- Identify the input values: Before using a trace table, you need to know the input values for the algorithm.
- Follow the algorithm: Use the trace table to follow the algorithm and record the values of the variables at each step.
- Check for accuracy: Check the final values in the trace table to ensure that the algorithm is working correctly.
Practice Questions:
- Create a trace table for the following algorithm:
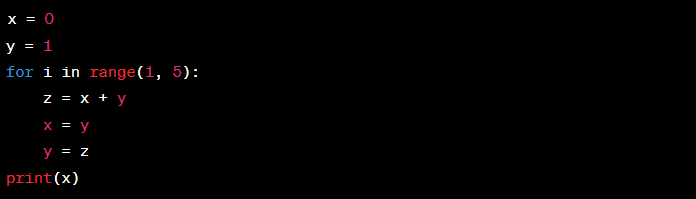
- Use a trace table to follow the algorithm and find the output for the following input values:
- x = 0
- y = 1
Answers:
- The trace table for the algorithm is:
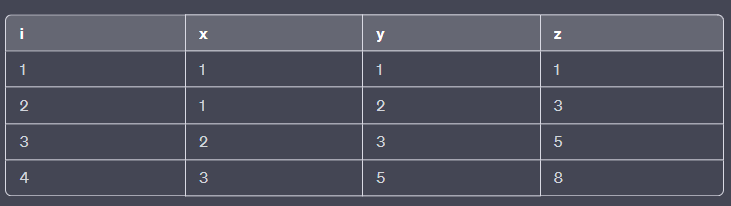
output/answer would be 3
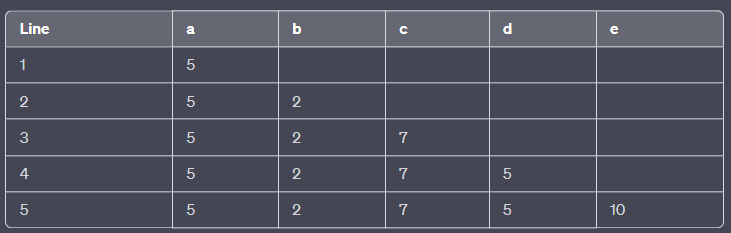
- Create a trace table for the following:
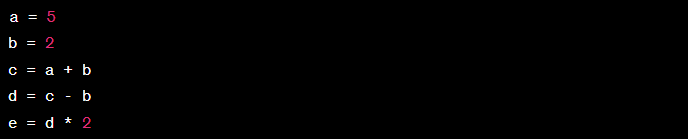
Answer:
Past Paper Questions